Tuesday 9 October 2007

Converging-Diverging Nozzle Applet

Introduction
The purpose of this applet is to simulate the operation of a converging-diverging nozzle, perhaps the most important and basic piece of engineering hardware associated with propulsion and the high speed flow of gases. This device was invented by Carl de Laval toward the end of the l9th century and is thus often referred to as the 'de Laval' nozzle. This applet is intended to help students of compressible aerodynamics visualize the flow through this type of nozzle at a range of conditions.

Technical Background
The usual configuration for a converging diverging (CD) nozzle is shown in the figure. Gas flows through the nozzle from a region of high pressure (usually referred to as the chamber) to one of low pressure (referred to as the ambient or tank). The chamber is usually big enough so that any flow velocities here are negligible. The pressure here is denoted by the symbol pc. Gas flows from the chamber into the converging portion of the nozzle, past the throat, through the diverging portion and then exhausts into the ambient as a jet. The pressure of the ambient is referred to as the 'back pressure' and given the symbol pb.

A simple example
To get a basic feel for the behavior of the nozzle imagine performing the simple experiment shown in figure 2. Here we use a converging diverging nozzle to connect two air cylinders. Cylinder A contains air at high pressure, and takes the place of the chamber. The CD nozzle exhausts this air into cylinder B, which takes the place of the tank.

Imagine you are controlling the pressure in cylinder B, and measuring the resulting mass flow rate through the nozzle. You may expect that the lower you make the pressure in B the more mass flow you'll get through the nozzle. This is true, but only up to a point. If you lower the back pressure enough you come to a place where the flow rate suddenly stops increasing all together and it doesn't matter how much lower you make the back pressure (even if you make it a vacuum) you can't get any more mass flow out of the nozzle. We say that the nozzle has become 'choked'. You could delay this behavior by making the nozzle throat bigger (e.g. grey line) but eventually the same thing would happen. The nozzle will become choked even if you eliminated the throat altogether and just had a converging nozzle.

The reason for this behavior has to do with the way the flows behave at Mach 1, i.e. when the flow speed reaches the speed of sound. In a steady internal flow (like a nozzle) the Mach number can only reach 1 at a minimum in the cross-sectional area. When the nozzle isn't choked, the flow through it is entirely subsonic and, if you lower the back pressure a little, the flow goes faster and the flow rate increases. As you lower the back pressure further the flow speed at the throat eventually reaches the speed of sound (Mach 1). Any further lowering of the back pressure can't accelerate the flow through the nozzle any more, because that would entail moving the point where M=1 away from the throat where the area is a minimum, and so the flow gets stuck. The flow pattern downstream of the nozzle (in the diverging section and jet) can still change if you lower the back pressure further, but the mass flow rate is now fixed because the flow in the throat (and for that matter in the entire converging section) is now fixed too.

The changes in the flow pattern after the nozzle has become choked are not very important in our thought experiment because they don't change the mass flow rate. They are, however, very important however if you were using this nozzle to accelerate the flow out of a jet engine or rocket and create propulsion, or if you just want to understand how high-speed flows work.

The flow pattern
Figure 3a shows the flow through the nozzle when it is completely subsonic (i.e. the nozzle isn't choked). The flow accelerates out of the chamber through the converging section, reaching its maximum (subsonic) speed at the throat. The flow then decelerates through the diverging section and exhausts into the ambient as a subsonic jet. Lowering the back pressure in this state increases the flow speed everywhere in the nozzle.

Lower it far enough and we eventually get to the situation shown in figure 3b. The flow pattern is exactly the same as in subsonic flow, except that the flow speed at the throat has just reached Mach 1. Flow through the nozzle is now choked since further reductions in the back pressure can't move the point of M=1 away from the throat. However, the flow pattern in the diverging section does change as you lower the back pressure further.

As pb is lowered below that needed to just choke the flow a region of supersonic flow forms just downstream of the throat. Unlike a subsonic flow, the supersonic flow accelerates as the area gets bigger. This region of supersonic acceleration is terminated by a normal shock wave. The shock wave produces a near-instantaneous deceleration of the flow to subsonic speed. This subsonic flow then decelerates through the remainder of the diverging section and exhausts as a subsonic jet. In this regime if you lower or raise the back pressure you increase or decrease the length of supersonic flow in the diverging section before the shock wave.

If you lower pb enough you can extend the supersonic region all the way down the nozzle until the shock is sitting at the nozzle exit (figure 3d). Because you have a very long region of acceleration (the entire nozzle length) in this case the flow speed just before the shock will be very large in this case. However, after the shock the flow in the jet will still be subsonic.

Lowering the back pressure further causes the shock to bend out into the jet (figure 3e), and a complex pattern of shocks and reflections is set up in the jet which will now involve a mixture of subsonic and supersonic flow, or (if the back pressure is low enough) just supersonic flow. Because the shock is no longer perpendicular to the flow near the nozzle walls, it deflects it inward as it leaves the exit producing an initially contracting jet. We refer to this as overexpanded flow because in this case the pressure at the nozzle exit is lower than that in the ambient (the back pressure)- i.e. the flow has been expanded by the nozzle to much.

A further lowering of the back pressure changes and weakens the wave pattern in the jet. Eventually we will have lowered the back pressure enough so that it is now equal to the pressure at the nozzle exit. In this case, the waves in the jet disappear altogether (figure 3f), and the jet will be uniformly supersonic. This situation, since it is often desirable, is referred to as the 'design condition'.

Finally, if we lower the back pressure even further we will create a new imbalance between the exit and back pressures (exit pressure greater than back pressure), figure 3g. In this situation (called 'underexpanded') what we call expansion waves (that produce gradual turning and acceleration in the jet) form at the nozzle exit, initially turning the flow at the jet edges outward in a plume and setting up a different type of complex wave pattern.

The pressure distribution in the nozzle
A plot of the pressure distribution along the nozzle (figure 4) provides a good way of summarizing its behavior. To understand how the pressure behaves you have to remember only a few basic rules

  • When the flow accelerates (sub or supersonically) the pressure drops
  • The pressure rises instantaneously across a shock
  • The pressure throughout the jet is always the same as the ambient (i.e. the back pressure) unless the jet is supersonic and there are shocks or expansion waves in the jet to produce pressure differences.
  • The pressure falls across an expansion wave.
The labels on figure 4 indicate the back pressure and pressure distribution for each of the flow regimes illustrated in figure 3. Notice how, once the flow is choked, the pressure distribution in the converging section doesn't change with the back pressure at all.

Operating Instructions for the applet.
All of the above description is quite a lot to understand and remember without actually having a converging diverging nozzle to look at. This is the ideal of the applet - to give you a model of a nozzle that you can play around with and get experience of.

To start the program, go to the applet page and press the button labeled 'Start!' a window like that shown below will appear.

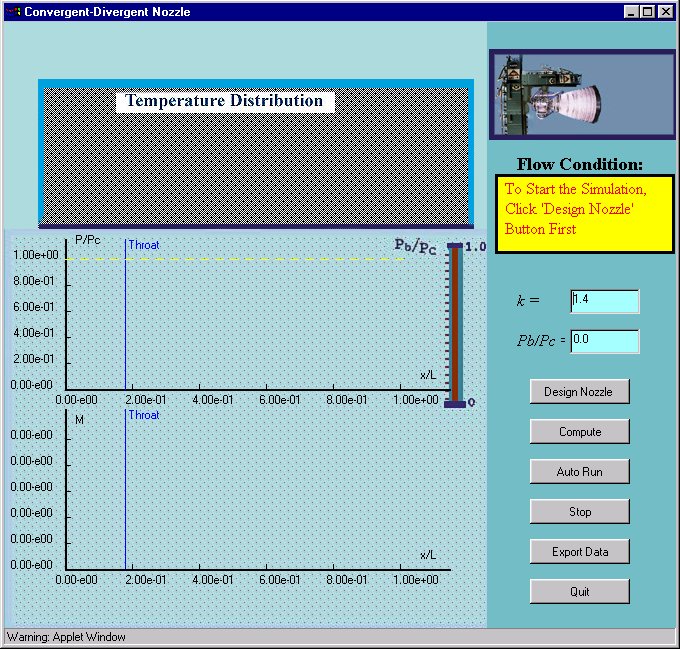
On the left hand side of the window there are three panels used for plotting the flow conditions in the nozzle. The top panel, shaded gray, is used to show the shape of the nozzle and a color contour map of the temperature distribution within it. Initially this region will be blank, note that the temperature distribution behaves qualitatively like the pressure distribution. The middle panel is used to display the pressure (vertical axis) as a function of distance down the nozzle (horizontal axis), and the lower panel displays the Mach number (flow speed over local speed of sound) as a function of distance. When results are displayed, the horizontal axes of these three panels all line up so the association between features on the different plots can easily be observed. On the top right of the applet window a graphic is displayed showing an actual rocket nozzle in a test stand. Below this is a yellow information panel, and then text areas where you can enter k the ratio of specific heats for the gas in the nozzle, and Pb/Pc the pressure ratio that is driving the flow through the nozzle. Below are a series of six buttons used to control the actions of the applet.

To begin press the 'Design Nozzle' button, which should bring up a window like that shown in the figure. On the right of the window there is a text area that allows you to enter the ratio of the exit area (Ae) to the throat area (At). This must be greater than 1. The larger the ratio, the higher the Mach number of the flow that your nozzle will produce (if you set this number very high, say >10) it may be difficult to see all the results clearly on the plots. Type in '4' and press the 'Set' button. The graph on the left shows the shape of the nozzle, chamber on the left, exit on the right. The program assumes you are dealing with an axisymmetric nozzle so, for example, your nozzle (with an area ratio of 4) will appear as having an exit with a diameter of twice that at the throat. You can change the shape of the diverging section by clicking the area shaded with '+' signs close to the line representing the diverging section. Note that you can't move the throat, or create a diverging section with a maximum in area - the program will warn you if either of these occurs. When you are satisfied with the shape, press the 'Done' button.

You can compute and display the flow through the nozzle in one of two ways. The most direct way is to enter a value for the back pressure in the text area labeled 'Pb/Pc'. Enter '0.5' and press the 'Compute' button. Almost instantaneously the results should be plotted as shown below.

The flow you have computed corresponds to case (c) in figure 3 above, i.e. flow with a shock in the nozzle (this is also stated in the yellow panel). On the top left of the frame a contour map of the flow temperature is plotted, normalized on the temperature in the chamber. Notice how the temperature falls as the flow accelerates up to and past the throat, and then suddenly rises in the shock wave. The center left plot shows the pressure distribution and beneath that is plotted the Mach number distribution. Notice how (of course) the Mach number is 1 at the throat in this case, and how the Mach number drops from super to subsonic across the shock wave. If you want you can access the numerical results of this calculation by pressing the 'Export data' button, copying out the numbers and pasting them into another application, like Excel, or Notepad.

The second way to compute the flow is the most useful if you want to see the whole range of phenomena present in the flow at different back pressures. To do this press the 'Auto Run' button. The program begins slowly lowers and raises the back pressure computing in small increments the entire flow and displaying the results. The net effect is an animation of what occurs in the nozzle as you raise and lower the back pressure. You can stop the animation at any time by pressing 'Stop'. To leave the applet you should press the 'Quit' button (pressing the 'X' at the top left hand corner of the frame doesn't work).

How the applet works.
The applet works by computing the flow using the one dimensional equations for the isentropic flow of a perfect gas, and the Rankine Hugoniot relations for normal shock waves in perfect gases. You can learn about these relations by reading, form example, Modern Compressible Flow, 2nd Edition, 1990, by John D. Anderson Jr. You can use the Compressible Aerodynamics Calculator to help you use these relations in your own calculations.

Boundary Layer Applets

Simple Examples
Each of the applets is pre-loaded with an example case. The following are descriptions of these six cases. Note that although the descriptions below call for the entering of certain values to set up the problem, these values should already be set in the applet when it is initialized.

Example 1, WALZ: Laminar Integral Method
Problem:
Consider 2D laminar flow of a fluid with a kinematic viscosity = 2.0x10⁻⁴m2/s at Uinf = 10.0 m/s over a surface that is a flat plate from the leading edge to x = 1.0 m. At that station, a ramp begins that produces an inviscid velocity distribution Ue(x) = 10.5 - x/2, m/s. This is an adverse pressure gradient, since Ue is decreasing so that p increases. Calculate the boundary layer development over this surface up to x = 2.0 m. Does the flow separate?
Solution:
We must provide input data for the kinematic viscosity as = 2.0x10⁻⁴m2/s and the freestream velocity as Uinf = 10.0 m/s. Select "Number of x steps" = 41, and "Maximum x/L" = 2, and "Reference Length L" = 1.0 m, to give a step size of 0.05 m. Using the surface characteristics dialog ("Change -> Surface properties", change the body shape to "2D body, sharp leading edge", and type in point pairs to define the bilinear inviscid velocity distribution required, e.g. 0 1.0, 0.5 1.0, 1.0 1.0, 1.5 0.975, 2.0 0.95. The code will fit a spline through the points used as input. Then, press the "Run" button and watch the skin friction and the integral quantities develop in the graphs. You may also select "Show -> Profile" and watch the implied velocity profile develop at the same time. Click here to see the window as it appears about halfway through the calculation, and at the end. Tabular values of the output can be accessed by selecting "Show -> Numerical Results" and copied into Excel for plotting and further analysis. Use "File -> Write parameter list" to save the input parameters of your calculation.

Example 2, ILBLI Laminar Implicit Numerical Method
Problem:
Consider 2D laminar flow of a fluid with a kinematic viscosity = 2.0x10⁻⁴m2/s at Uinf = 10.0 m/s over a surface that is a flat plate from the leading edge to x = 1.0 m. At that station, a ramp begins that produces an inviscid velocity distribution Ue(x) = 10.5 - x/2, m/s. This is an adverse pressure gradient, since Ue is decreasing so that p increases. Calculate the boundary layer development over this surface up to x = 2.0 m. Does the flow separate?
Solution:
This is the same flow problem solved with the Thwaites-Walz integral method using the code WALZ. Now, we can apply the implicit numerical method in code ILBLI to this problem for comparison in terms of accuracy of the predictions and computational effort required. Since the first part of the problem is flow over a flat plate Blasius solution can be used to obtain "initial" conditions at x = 1.0. Thus, the numerical calculation will begin at x = 1.0 and go to x = 2.0. Set "Starting x/L" = 1.0 and "Maximum x/L" = 2.0. We must again provide input data for the kinematic viscosity as = 2.0x10⁻⁴m2/s and the freestream velocity as Uinf = 10.0 m/s. Select "Reference Length L" = 1.0m, The Blasius solution at x = 1.0 gives the initial boundary layer thickness of delta = 0.0224. Choose the "Number of y steps" to be 100 and the step size to be 0.00112, giving about 20 steps across the initial boundary layer thickness. Since the implicit method is unconditionally stable, no stability criterion need be followed, and we can select the "Number of x steps" based only on accuracy considerations. Select 41 to give a step size of 0.025, which is about the size of the initial boundary layer thickness. Initial profiles for u and v are required. For simplicity, we use a Polhausen profile for u and set v = 0 as adequate approximations to the exact Blasius solution ("Change -> Initial Profile"). Since this case has a linear edge velocity variation velocities at only two points need be specified. Using the surface characteristics dialog, type in point pairs 1.0 1.0, 2.0 0.95. Press the "Run" button and watch the skin friction and the integral quantities develop in the graphs. You may also select "Show -> Profile" and watch the computed u and v velocity profiles develop at the same time. Click here to see the window as it appears about halfway through the calculation, and at the end. Tabular values of the output can be accessed by selecting "Show -> Numerical Results" and copied into Excel for plotting and further analysis. Use "File -> Write parameter list" to save the input parameters of your calculation.

Example 3, MOSES Turbulent Integral Method
Problem:
Consider 2D turbulent flow of a fluid with a kinematic viscosity = 1.0x10⁻⁵m2/s at Uinf = 10.0 m/s over a surface that is a flat plate from x = 0.0 to 5.0 m. Then, a ramp begins that produces an inviscid velocity distribution Ue(x) = 15 - x, m/s. Calculate the boundary layer to x = 7.0 m and determine if the flow separates.
Solution:
Set "Starting x/L" = 4.0 and "Maximum x/L" = 7.0. We must provide input for the kinematic viscosity as = 1.0x10⁻⁵m2/s and the freestream velocity as Uinf = 10.0 m/s. Select "Number of x steps" = 21, and "Reference Length L" = 1.0 m, to give a step size of 0.10 m. Since the part of the calculation upstream of x=4.0 is over a flat plate, the simple integral solution (see section 7-7 of Schetz, 1993, "Boundary Layer Analysis") can be used to infer the initial boundary layer thickness at x=4.0 of 0.072m. Using the surface characteristics dialog ("Change -> Surface properties") type in two point pairs to define the bilinear inviscid velocity distribution, e.g. 4.0 1.0, 4.25 1.0, 4.5 1.0, 4.75 1.0, 5.0 1.0, 5.5 0.95, 6.0 0.9, 6.5 0.85, 7.0 0.8. The code will fit a spline through the points used as input. Then, press the "Run" button and watch the skin friction and the integral quantities develop in the graphs. You may also select "Show -> Profile" and watch the implied velocity profile develop at the same time. Click here to see the window as it appears about halfway through the calculation, and at the end. Tabular values of the output can be accessed by selecting "Show -> Numerical Results" and copied into Excel for plotting and further analysis. Use "File -> Write parameter list" to save the input parameters of your calculation.

Example 4, ITBL Turbulent Numerical Method
Problem:
Consider 2D turbulent flow of a fluid with a kinematic viscosity = 9.3x10⁻⁷m2/s at Uinf = 3.049 m/s (10 ft/s) over a flat plate from x = 1.524 to 1.829 m (5 to 6ft.) Use all three available turbulence models and compare the results.
Solution:
Set "Starting x/L" = 1.524, "Maximum x/L" = 1.829, "Kinematic viscosity" = 9.3x10⁻⁷m2/s , "Freestream velocity" = 10.0 m/s, and "Reference Length L" = 1.0 m. The simple integral solution (see Sec. 7-7 in Schetz, 1993, "Boundary Layer Analysis") can be used to obtain "initial" conditions at x = 1.524m, giving delta = 0.0261 m. Choose "Number of y steps"= 1000, and a "y step size"= 4.3x10⁻⁵m - this will result in about 600 points across the initial boundary layer thickness, and set "Number of x steps"= 101 to give a step size about one tenth of the initial boundary layer thickness. For simplicity, we use a Coles profile for u and set v = 0 at the upstream boundary ("Change -> Initial Profile"). Using the surface characteristics dialog ("Change -> Surface properties") we select "Zero pressure gradient". Lastly, the turbulence model must be selected ("Change -> Turbulence Model"). The default value is a mixing length model. Press the "Run" button and watch the skin friction and the integral quantities develop in the graphs. You may also select "Show -> Profile" and watch the computed velocity profiles develop at the same time. Click here to see the window as it appears about halfway through the calculation, and at the end. Tabular values of the output can be accessed by selecting "Show -> Numerical Results" and copied into Excel for plotting and further analysis. Finally, repeat the calculation with the other two turbulence models. Use "File -> Write parameter list" to save the input parameters of your calculation.

Example 5, WALZHT Laminar Integral Method with Heat Transfer
Problem:
Consider 2D laminar flow of a fluid with a kinematic viscosity 1.6x10⁻⁵m2/s, Cp = 1005 J/kg/K, density = 1.2 kg/m3 and Prandtl number Pr =
0.72 at Uinf = 2.0 m/s over a surface that is a flat plate from the leading edge to x = 1.0 m. At that station, a ramp begins that produces an inviscid velocity distribution Ue(x) = 2.1 - x/10, m/s. The wall to freestream temperature difference, Tw - Te = 20oC. Calculate the boundary layer development over this surface up to x = 2.0 m. Does the flow separate? Note how the dimensionless wall shear, Cf, and dimensionless heat transfer, Nu, vary in the constant pressure and varying pressure regions along the surface.
Solution:
Enter the viscosity, density, specific heat, Prandtl number, free-stream velocity, reference length (1m) and maximum x/L (2.0). Using the surface characteristics dialog ("Change -> Surface properties"), select "2D body, sharp leading edge" and type in groups of three numbers to define the inviscid velocity and temperature difference distributions, e.g.

 0.0000e+000  1.0000e+000  2.0000e+001
 2.5000e-001  1.0000e+000  2.0000e+001
 5.0000e-001  1.0000e+000  2.0000e+001
 7.5000e-001  1.0000e+000  2.0000e+001
 1.0000e+000  1.0000e+000  2.0000e+001
 1.2500e+000  9.8750e-001  2.0000e+001
 1.5000e+000  9.7500e-001  2.0000e+001
 1.7500e+000  9.6250e-001  2.0000e+001
 2.0000e+000  9.5000e-001  2.0000e+001
The code will fit a spline through the points used as input. Press the "Run" button and watch the skin friction and the integral quantities develop in the graphs. You may also select "Show -> Profile" and watch the assumed velocity profile develop at the same time. You may click on the graphs, or select "Change -> Plot options" to change the quantities plotted. Click here to see the window as it appears about halfway through the calculation, and at the end. Tabular values of the output can be accessed by selecting "Show -> Numerical Results" and copied into Excel for plotting and further analysis. Use "File -> Write parameter list" to save the input parameters of your calculation.

Example 6 Turbulent Integral Method
Problem:
Consider 2D turbulent flow of a fluid with a kinematic viscosity 1.0x10⁻⁵m2/s, Cp = 4187 J/kg/K, density = 1.2 kg/m3 and Prandtl number Pr =
5 at Uinf = 10.0 m/s over a surface that is a flat plate from x=0.0 to 7.0 m assuming a simple inviscid velocity distribution Ue(x) = 10 m/s = constant. Calculate the boundary layer properties betwee x=5.0 and 7.0m where the temperature difference is 10K. Determine the heat transfer?
Solution:
Enter the viscosity, density, specific heat, Prandtl number, free-stream velocity, reference length (1m), starting x/L (5.0) maximum x/L (7.0). Using the surface characteristics dialog ("Change -> Surface properties"), specify the surface velocity and temperature distributions. Since both are constant it is only necessary to specify 2 points;

 5.0000e+000  1.0000e+000  1.0000e+001
 7.0000e+000  1.0000e+000  1.0000e+001
Since the first part of the flow (to x=5.0m) is over a flat plate, the simple integral solution (see Sec. 7-7 in Schetz, 1993) can be used giving an initial boundary layer thickness of 0.0857 m. Take St = 6.89x10⁻⁴ at the initial station. Pick 20 x steps, giving a step size of 0.1m, roughly equal to the initial boundary layer thickness. Press the "Run" button and watch the skin friction and the integral quantities develop in the graphs. You may also select "Show -> Profile" and watch the assumed velocity profile develop at the same time. You may click on the graphs, or select "Change -> Plot options" to change the quantities plotted. Click here to see the window as it appears about halfway through the calculation, and at the end. Tabular values of the output can be accessed by selecting "Show -> Numerical Results" and copied into Excel for plotting and further analysis. Use "File -> Write parameter list" to save the input parameters of your calculation.


Examples using multiple applets

Example 7. Comparing Methods
Problem:
Repeat example 3 above using the integral and finite difference methods, and compare results.
Solution:
Perform the calculation described in example 3 using MOSES. When the calculation is complete, select "File -> Launch". Using the choice field in the top left hand corner select "Launch ITBL". Use the choice field a top center to select "From starting location" (dialog should look like this). Click "Launch" and the dialog will dissappear and an ITBL window will open. Check the values and parameters already loaded into ITBL and you will find that they are identical to those you used/specified with MOSES. Click "Run" to perform the calculation with ITBL. Use "Show -> Numerical Results" in both applets to copy and past results into Excel and compare. How does the disagreements between the two methods compare to the differences from using different turbulence models in ITBL?

Example 8. Full Boundary Layer Undergoing Transition
Problem:
Compute the drag on a 3m long 1m wide weather vane in a wind of 10m/s. Due to the roughness of the weather-vane surface the flat-plate transition Reynolds number Rex is thought to be about 2.5x10⁵.
Solution:
Using WALZ, enter the maximum x/L location as 3, reference length L as 1 m, and change the transition Reynolds number to 250,000. Using the surface properties dialog "Change -> Surface properties", select "2D body, sharp leading edge" and "Zero pressure gradient" (we are assuming that the weather vane will move to zero angle of attack). Using standard atmospheric conditions we may take the kinematic viscosity as 1.45x10⁻⁵. Press "Run" and observe the development of the calculation. Note the that the calculation stops prematurely at a location marked with a "T". This indicates that transition has been detected. Look at the numerical results (Show -> Numerical Results) and you will see that, since transition occured, only about 12 calculation steps were actually performed. To improve the accuracy of this pre-transition calculation, change the "Maximum x/L" to 0.5, just downstream of the transition location. This effectively reduces the step size to 0.005m. Press "Run" again and observe the calculation which now has sufficient detail. To determine the exact transition location, look at the numerical results (Show -> Numerical Results) and scroll to the bottom of the table. Copy the position (3.2729e-001), and close the numerical results dialog. Now, to start the turbulent boundary layer calculation (which we will choose to do using MOSES), select "File -> Launch", and then "Launch MOSES" (using the top left selector) and "From x/L = " (using the top center selector) and paste the transition location you just copied into the text area at the top right. Press "Launch" and MOSES will open up, preset with all the necessary information, including a starting x location and an initial boundary layer thickness corresponding to the transition location determined by WALZ. Edit the maximum x location to 3.0, and press "Run" to complete the boundary layer calculation using this turbulent method and observe the development of its parameters following transition. Finally open the numerical results windows in both applets, and copy and paste the results into Excel (or another spreadsheet). Integrate the distributions of skin friction coefficient to obtain the total drag due to the laminar and turbulent portions of the boundary layer. Don't forget to multiply by two to account for the two sides of the weather vane.


Advanced and unsolved problems

Example 9. Analysis of a NACA 0012 airfoil
Problem:
Calculate the aerodynamic characteristics of a 2m chord NACA 0012 airfoil flying at 2 degrees angle of attack at a speed of 50m/s into air at sea-level conditions.
Solution:
Use the vortex panel method, and the 200 panel description of a NACA 0012 airfoil provided along with it, to calculate the inviscid solution for this foil at 2 degrees angle of attack. This will immediately give you the lift and moment coefficients, but you need to do a boundary layer calculation to get the drag and boundary layer characteristics. Select "s, U (upper)" to output the edge length/velocity distribution for the suction side of the airfoil. Start WALZ, and open the surface properties dialog box. Select "2D body, rounded leading edge", and paste in the velocity distribution from the vortex panel method (less column headers). Change the viscosity to 1.45x10⁻⁵, the reference length L to 2m, and the freestream velocity to 50 m/s. Set the maximum x/L to 1.0249 (i.e. the trailing edge position, measured in chords along the airfoil surface from stagnation) and choose the transition Reynolds number, say 500,000. Set the number of x steps to 1000 - you want a lot of detail around the leading edge. Press "Run" and the calculation will develop as shown here until transition is reached (at about 10% chord). Now transfer the transition location and calculation to MOSES (or ITBL) using the same procedure applied in example 8. Perform the calculation and observe the boundary layer development. Paste numerical results from WALZ and MOSES into Excel, ready for analysis and integration. Now return to the vortex panel method. Select "s, U (lower)" to output results for the pressure side of the airfoil, and repeat the process.

Example 10. Repeat problem 9 at several larger angles of attack until the airfoil stalls (see Notes). Plot your results against actual measurements from Abbot and von Doenhoff's "Theory of Wing Sections".

Example 11. Perform inviscid/boundary layer calculations on the flow past a circular cylinder. Use potential flow theory or the vortex panel method to obtain the inviscid velocity distribution. Compute the separation location as a function of Reynolds number. At what Reynolds number does the boundary layer undergo transition on the forward face of the cylinder (for a flat plate transition Reynolds number of 500,000, say)? What affect dows that have on the transition location? Compare your results with published measurements?


Current Applet Version 2.1. Last HTML/Applet update 4/19/02. Questions or comments please contact William J. Devenport

Jurnal dan E-Book

Jurnal dan E-Book mengenai kuliah Teknik Mesin
Anda bisa download disini :

Mechanical Engineering Handbook download
Mechanical Engineering Handbook (Frank Kreith) download

Bidang Studi Design :
Machine Design download
Text Book of Machine Design download
Mechanical Design Engineer Handbook download
SAE-Vehicle Design download
SAE-Automotive Chassis download
Gears download
Piping Pipe Drafting and Design download
Automotive Transmissions download
Ansys Mechanical download
Mechanical Dekstop 2005 download
Mechanical Vibration download
Mechanical Design Solution 1 download
Mechanical Design Solution 2 download
Coupling and Joints download
Pneumatic actuators download
Gears for Mechanical Engineering download
Schaum Machine Design download
Komik Transmisi download

Bidang Studi Konversi Energi :
Fundamentals of Engineering Thermodynamics - moran j saphiro download
Fundamentals of Engineering Thermodynamics - moran j saphiro solution manual download
Intoduction to Fluid Mechanics Solution Manual Fox-5th ed download
Fundamentals of Heat and Mass Transfer - Incropera download
Fundamentals of Heat and Mass Transfer manual solution - Incropera download
Heat Transfer Handbook download
Hand book of Thermodynamics, Heat Transfer, and Fluid Flow download 1 download 2 download 3
Air Conditioning and Refrigerator download
Heat And Mass Transfer download
Fluid Mechanic download
Fundamentals of Compressible Flow Mechanics download
Centrifugal Pump Handbook download
Centrifugal Pump Designs and Aplication download
Reciprocating Compressor download
Fluid Mechanics download
Aerodinamics, Aeronautics and Flight Mechanics download
Thermodynamics and Introductory Statistiscal Mechanics download

Bidang Studi Metalurgi dan Material :
Mechanical Properties of Engineered Materials download
Mechanical Metalurgy download
Mechanical and Corrosion download
Material Science and Engineering download
Mechanical Properties of Material download

Bidang Studi Manufaktur :
The Design of Manufacturing Systems download
Modeling, Measurement, and Control download
Manufacturing download
Catia v5R12 tutorial bag1 download
Catia v5R12 tutorial bag2 download
Catia v5R12 tutorial bag3 download
Catia v5R12 tutorial part design download
Artificial intelligence and Robotics download
Fundamentals of Die Casting Design download
Blow Molding download
Plastic Part Design and Manufacturing download
Injection Molding download
Injection Molding zip download
Injection Molding1 PPT download
Injection Molding2 PPT download
Statistical Quality Control download
Minitab Quality Control download
Maintenance Engineering Handbook download
Reliability Handbook download
Safety, Reliability, and Risk Management download
Industrial Machinery Repair download
Machinery Component Maintenance download
Mechatronics download
Mechanical Engineering Robotics download
Mechatronics Handbook download
Basic Instrumentation, measuring, and PID control download
PID Advanced controller - MATLAB download
Pengendalian Otomatis Materi kuliah - introduction download
Pengendalian Otomatis Materi kuliah - Modeling of Dinamics System download
Pengendalian Otomatis Materi kuliah - Hand out Matlab1 download
Pengendalian Otomatis Materi kuliah - Hand out Matlab2 download

New !!!

Beberapa ebook juga tersedia dalam bentuk CD (DVD), bila Anda berkeinginan untuk mengcopynya, silakan datang ke Lab Manufaktur (D301 Jurusan Teknik Mesin ITS), kami akan meminjamkan DVD tersebut selama 1 hari, bila ada kerusakan maka akan menjadi tanggungan pihak peminjam.

Semoga bisa bermanfaat…